
Hopes for progress in the Middle East conflict led to a temporary fall in long-term interest rates. However, the recent escalation led to a renewed rise in yields. Government bonds trended sideways overall last month.
Market overview: Financial markets show a positive trend
The mood on the financial markets last month was generally favourable. The equity markets continued their upward trend, with price gains increasingly driven by a broader base. Hopes of easing tensions in the Middle East and concerns over the recent escalation of the conflict alternated on the bond markets, leading to sharp fluctuations in long-term interest rates.
Indexed performance of government bonds in local currency
100 = 01.01.2026
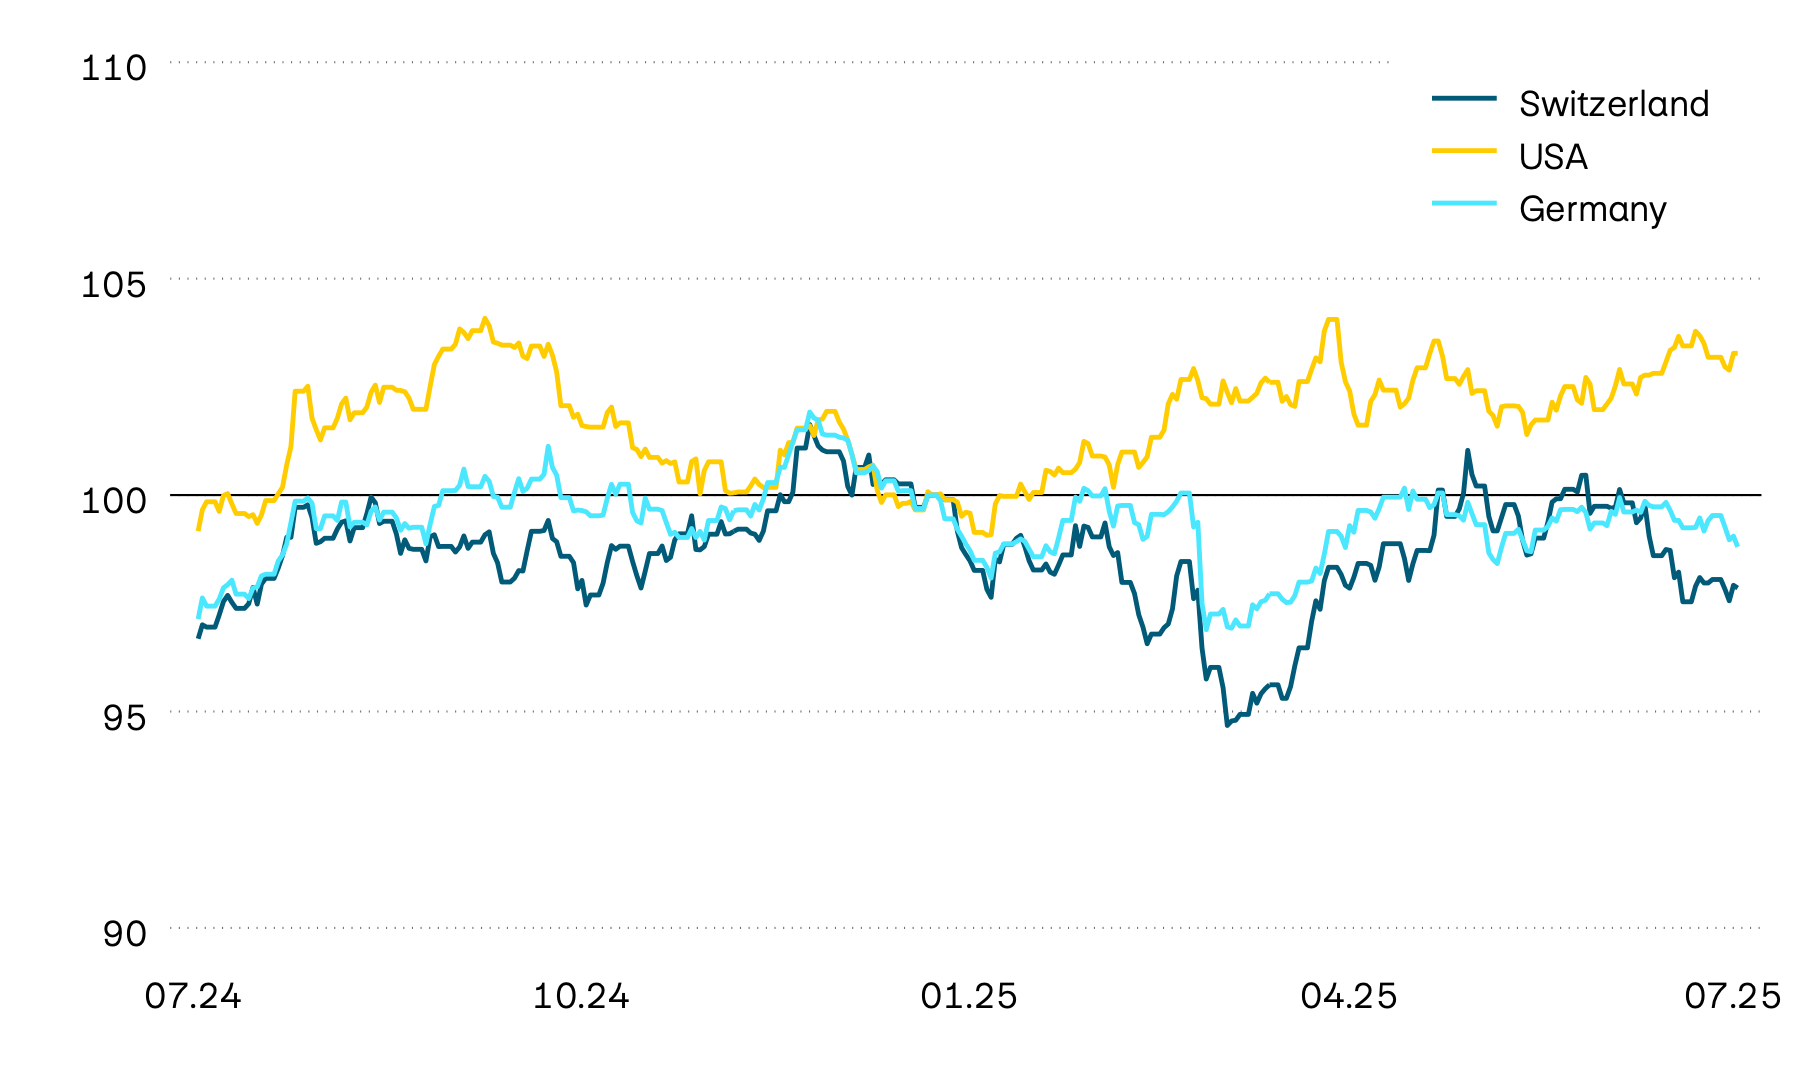
Government bonds trended sideways overall last month. In Europe, lower inflation rates initially led to a fall in long-term interest rates and a corresponding rise in bond prices. In the USA, interest rates fell temporarily after hopes of easing tensions in the Middle East conflict led to a fall in the price of oil, easing concerns over inflation. However, long-term interest rates on both sides of the Atlantic rose again towards the end of the month. While robust economic data bolstered interest rates in the USA, the renewed escalation in the Middle East weighed on the bond markets recently.
Trend in 10-year yields to maturity
In percent
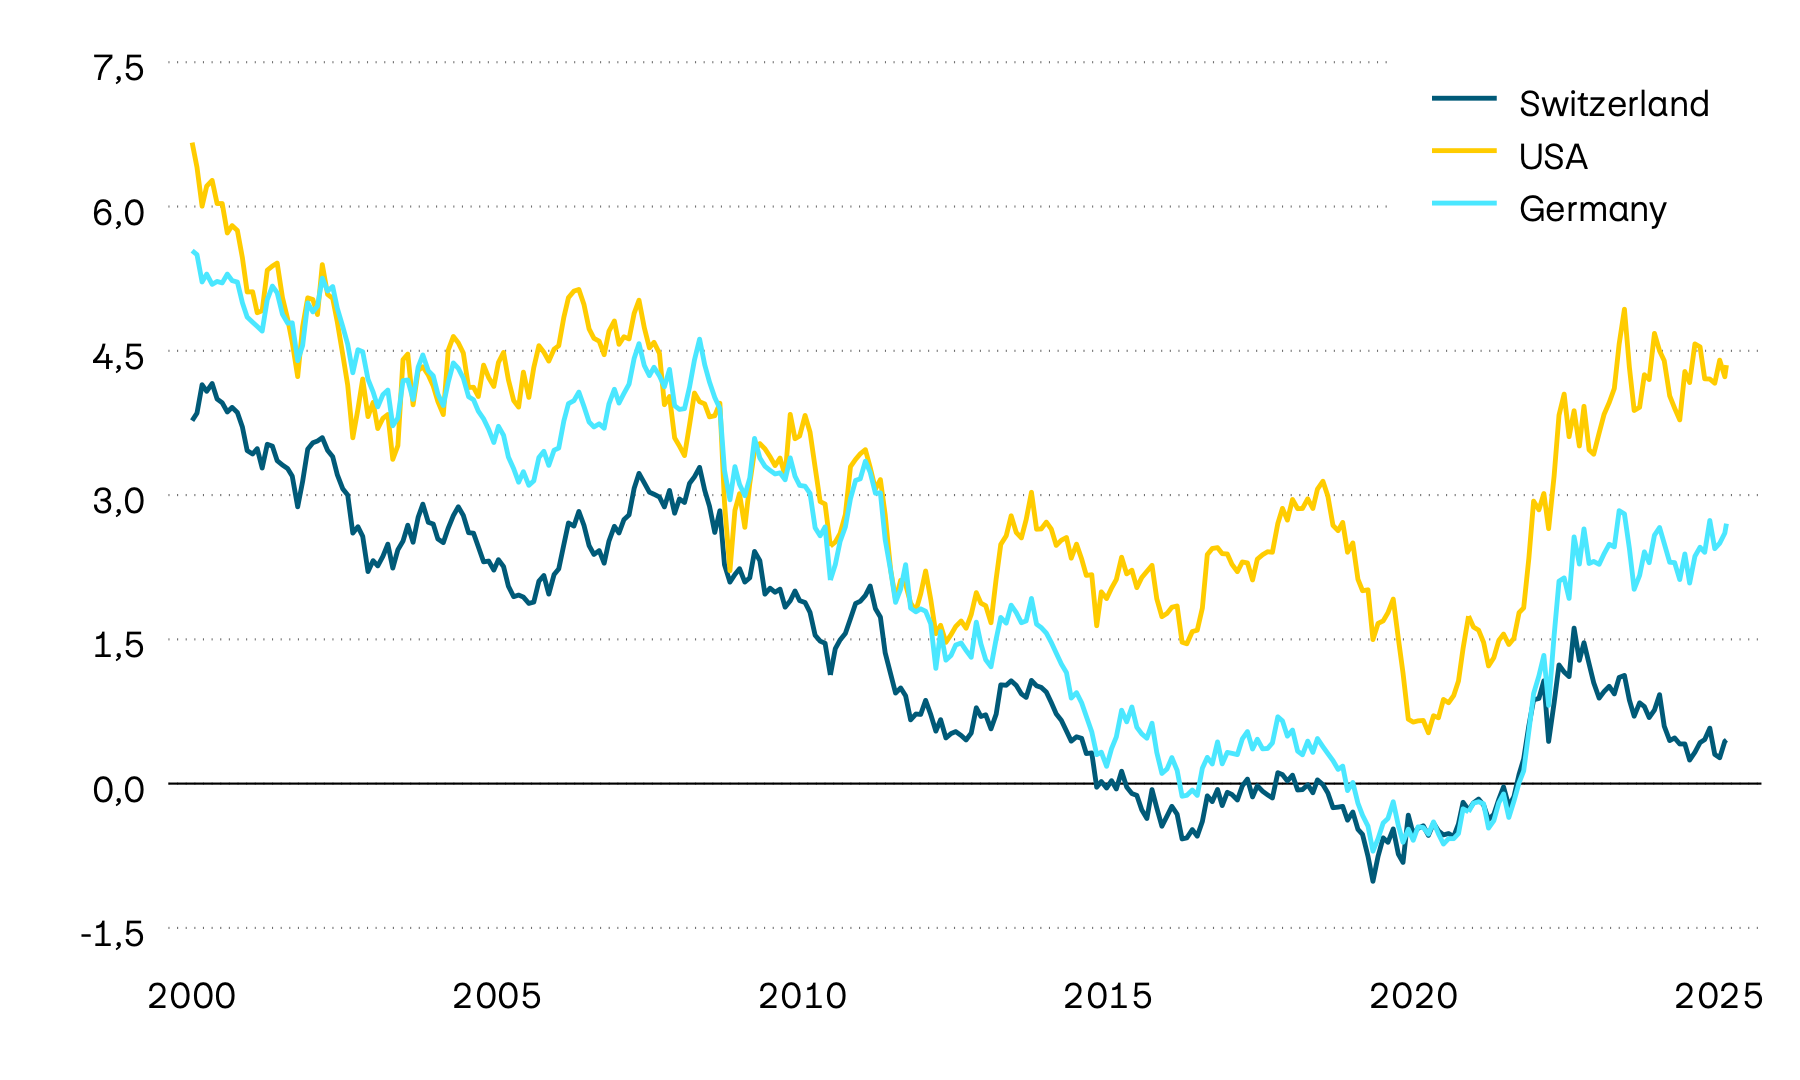
Yields to maturity on 10-year government bonds saw little change month-on-month. Since the start of the year, they have therefore remained much higher in most advanced economies. While falling inflation temporarily eased inflation concerns in Europe, interest rates in the USA remained high in view of the robust economy and the US Federal Reserve’s restrictive stance. The recent escalation in the Middle East put renewed upward pressure on long-term yields. The response was particularly pronounced in Japan, where 10-year yields to maturity rose sharply at times due to the high degree of dependency on energy imports.
Credit spreads on corporate bonds
In percentage points
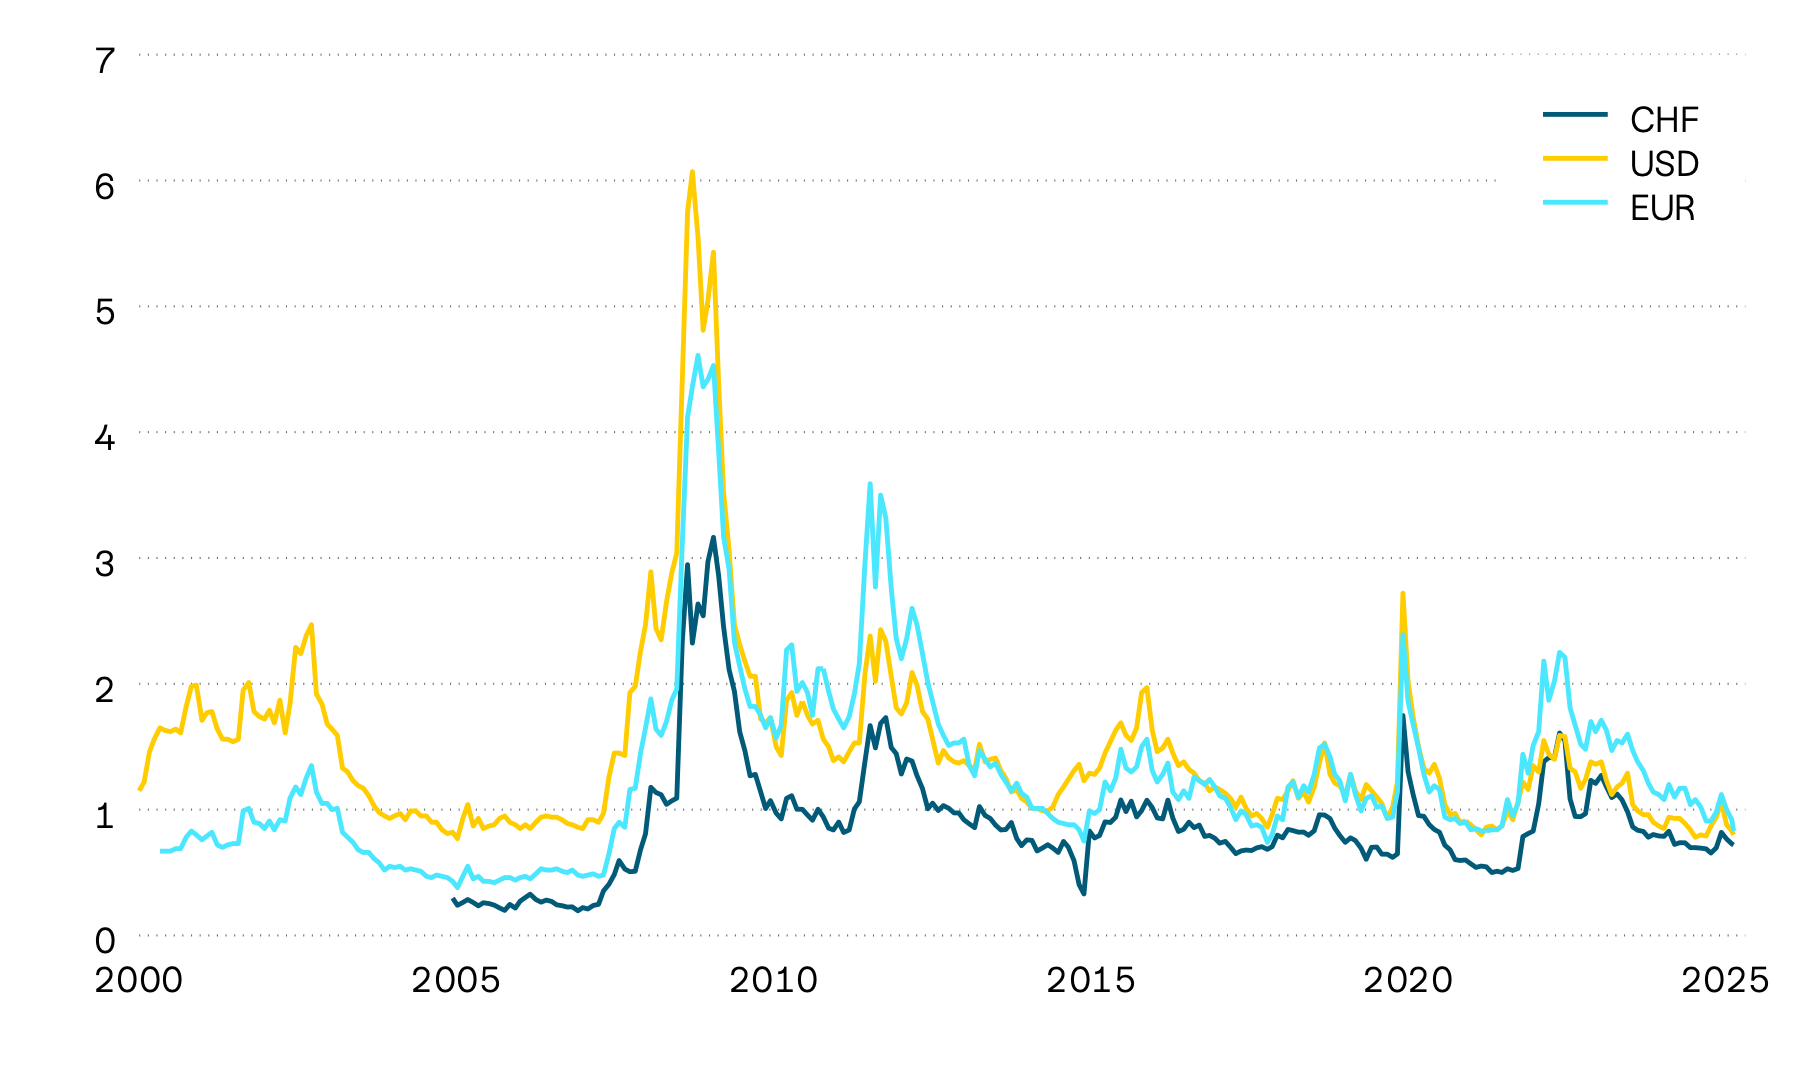
Credit premiums on corporate bonds remained largely unchanged last month and continue to trade at a historically low level. Credit spreads widened slightly only for European high-yield bonds. Overall, the current level indicates that investors still have a high risk appetite. At the same time, the potential for further narrowing remains limited, while credit premiums could widen rapidly if the economic environment deteriorates.
The equity markets continued their upward trend. In contrast to previous months, however, the companies benefiting most from the AI boom were no longer the main price drivers.
Indexed stock market performance in Swiss francs
100 = 01.01.2026
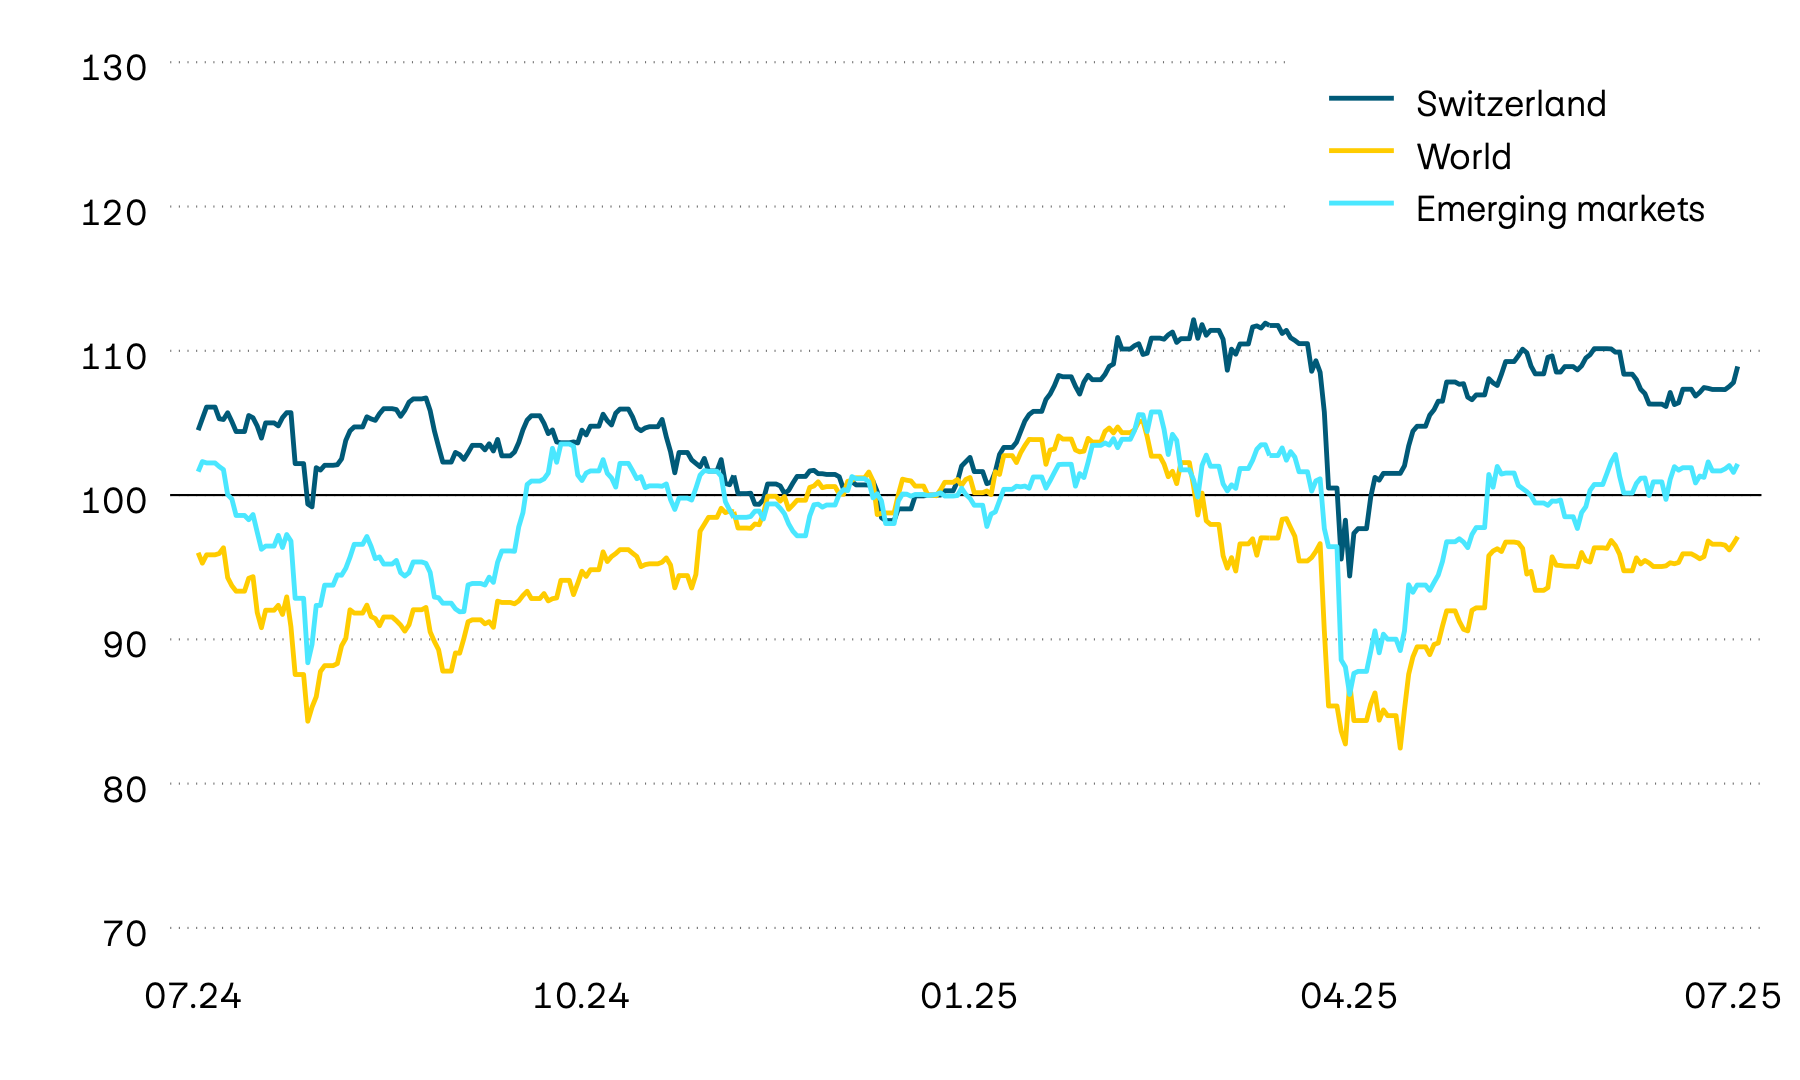
Global equity markets made further gains last month. However, the increase was not driven primarily by the heavyweights benefiting most from the AI boom, but by a broader base. The healthcare sector performed especially strongly, lifting the Swiss equity market. The latter rose by just under 6 percent last month and, with annual returns of over 10 percent, is almost on par with the European and US equity markets, which have risen by around 10 and 12 percent respectively, measured in Swiss francs since the start of the year.
Momentum of individual markets
In percent
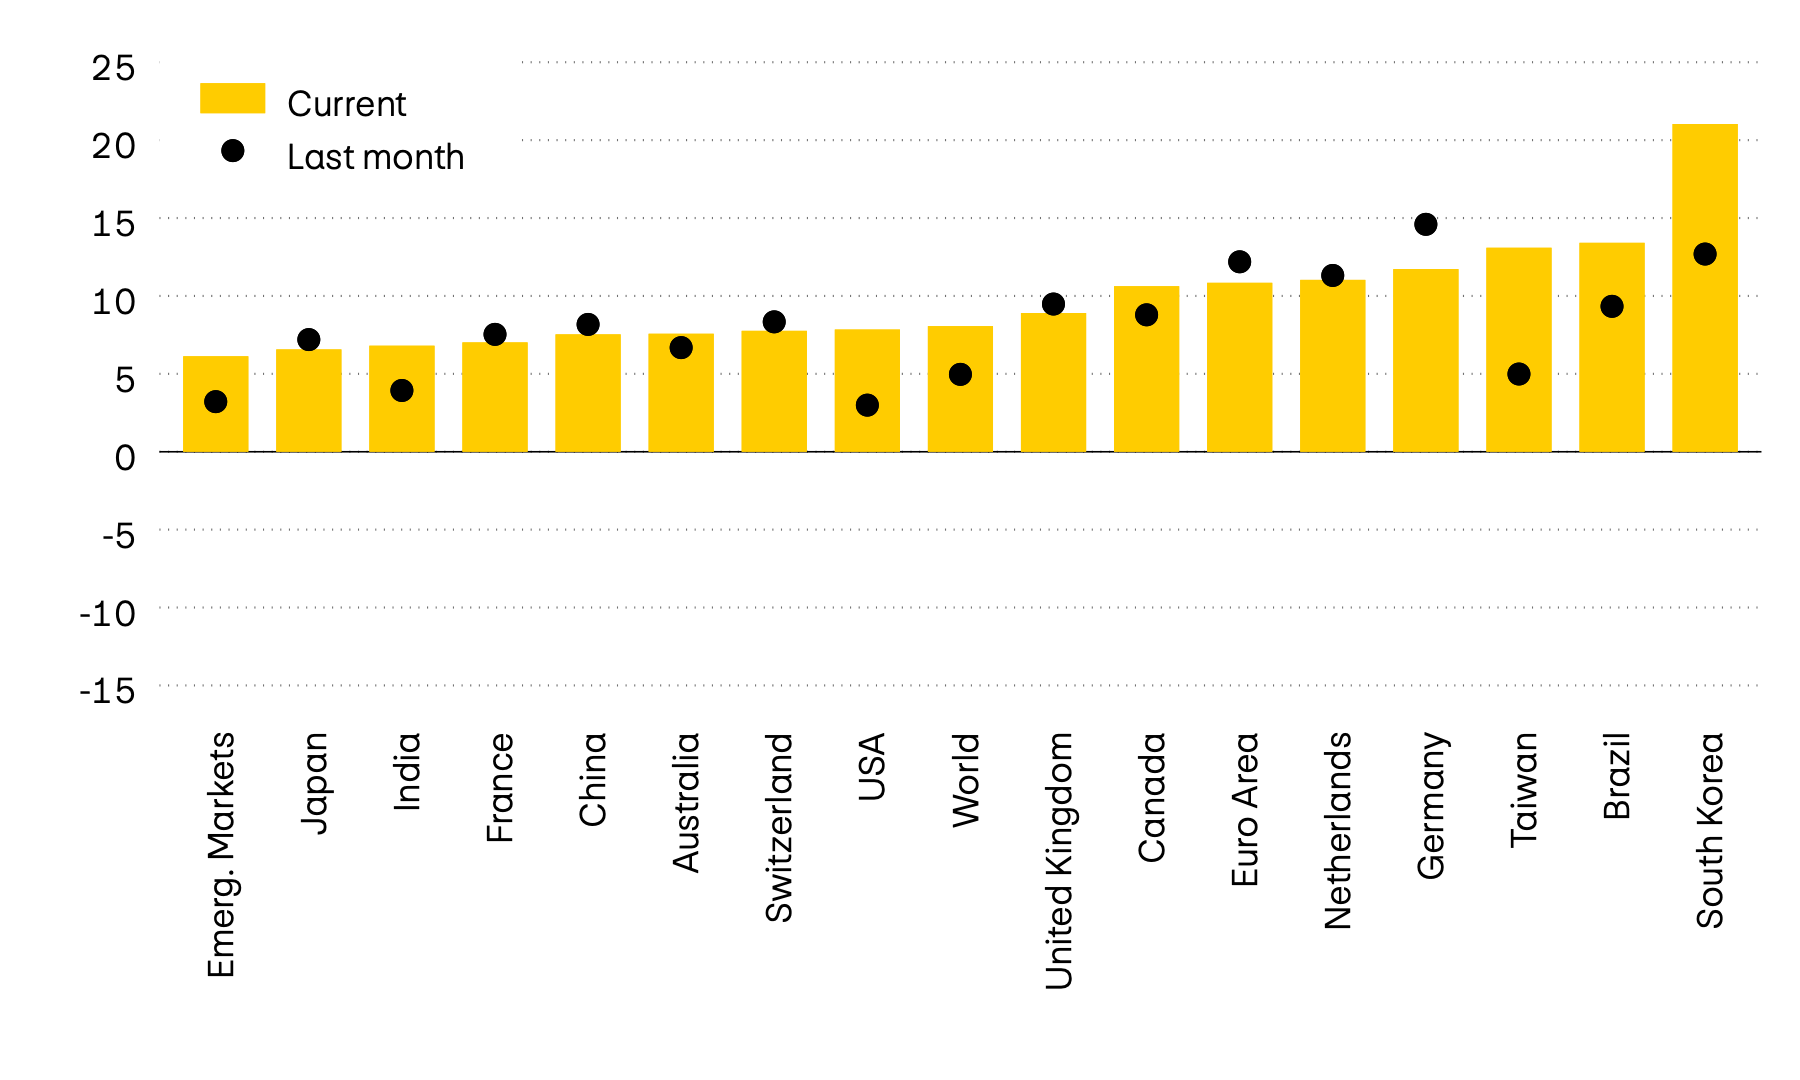
Momentum on the global equity markets remains positive overall. One exception is China, where the ongoing weak economy and structural economic problems continue to weigh on the equity market. In Taiwan and South Korea, the previously exceptionally strong momentum slowed significantly due to the recent setback in the AI sector. Despite this correction, both markets have continued to post the highest returns and the strongest momentum since the start of the year.
Price/earnings ratio
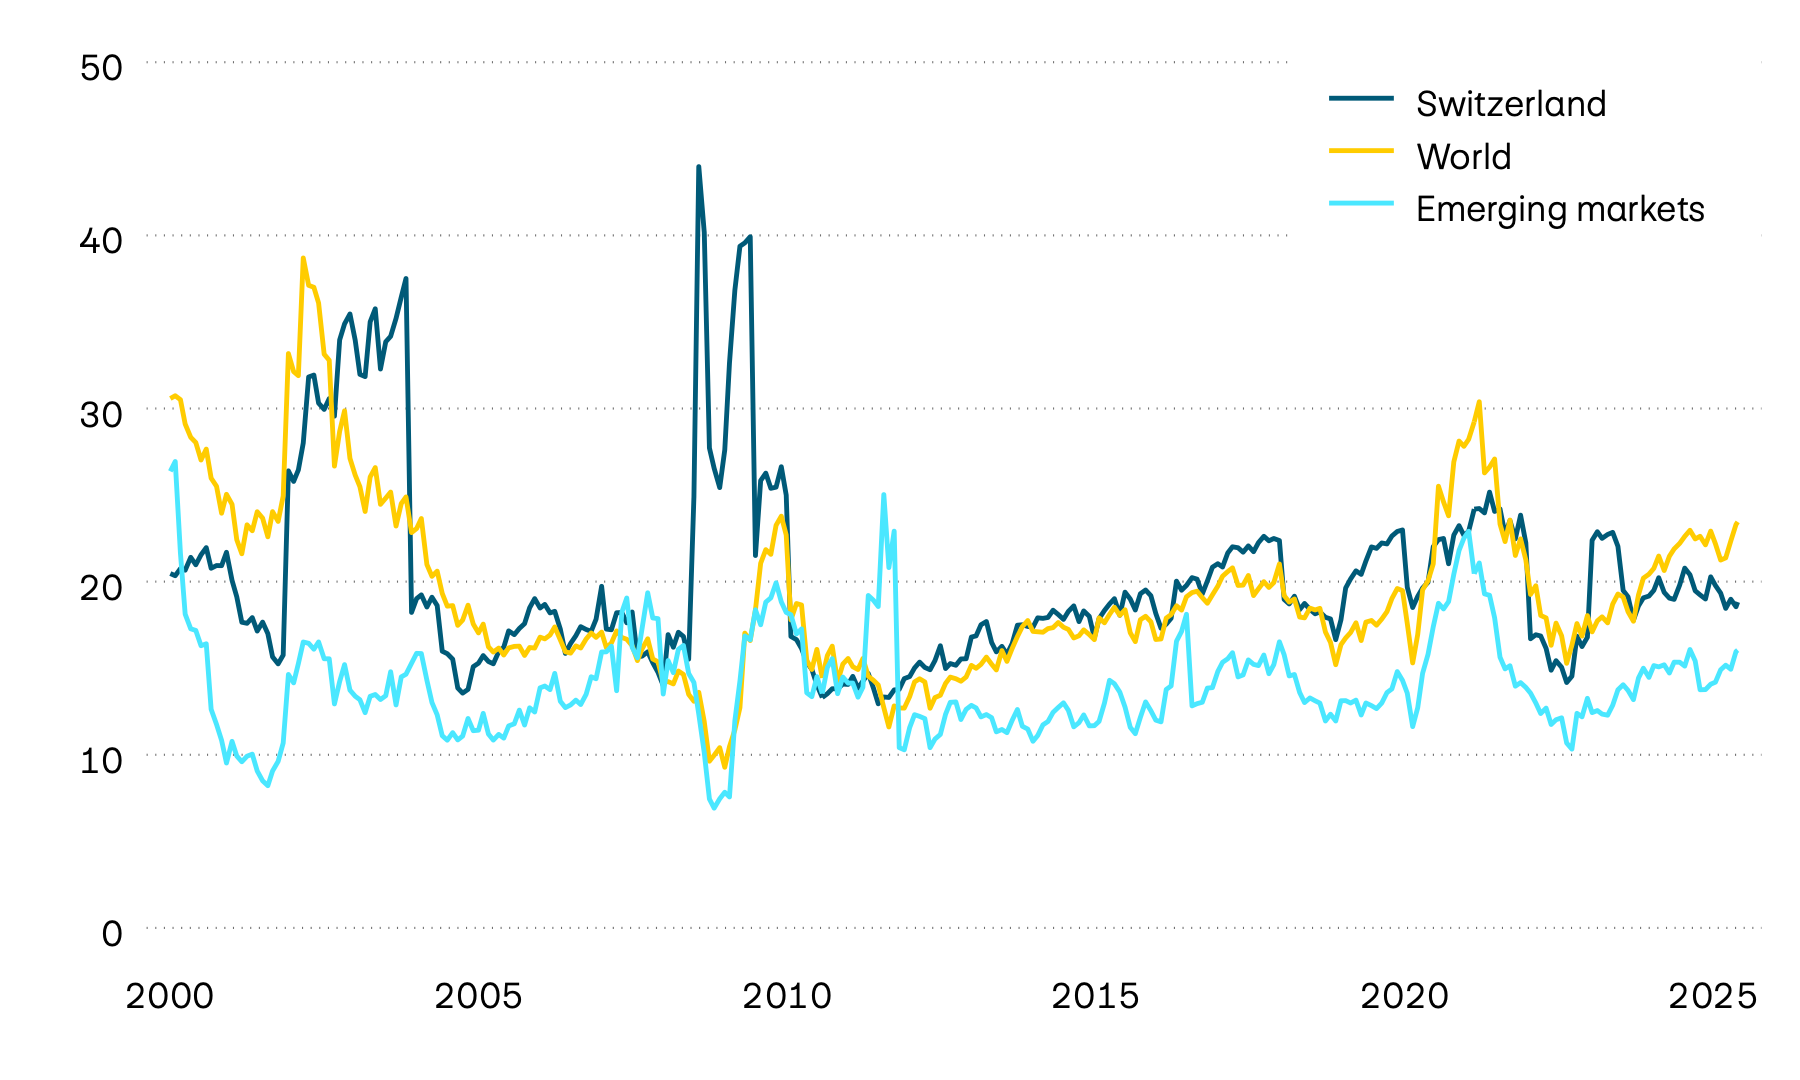
Valuation levels on global equity markets trended upwards again last month. The rise was most evident on the Swiss equity market. Buoyed by a broad-based price rally, its valuation level has now moved closer to that of global equity markets. In the USA, expectations for the current reporting season are once again very high: the S&P 500 companies’ expected year-on-year earnings growth has increased again compared to the previous quarter and now stands at 23 percent.
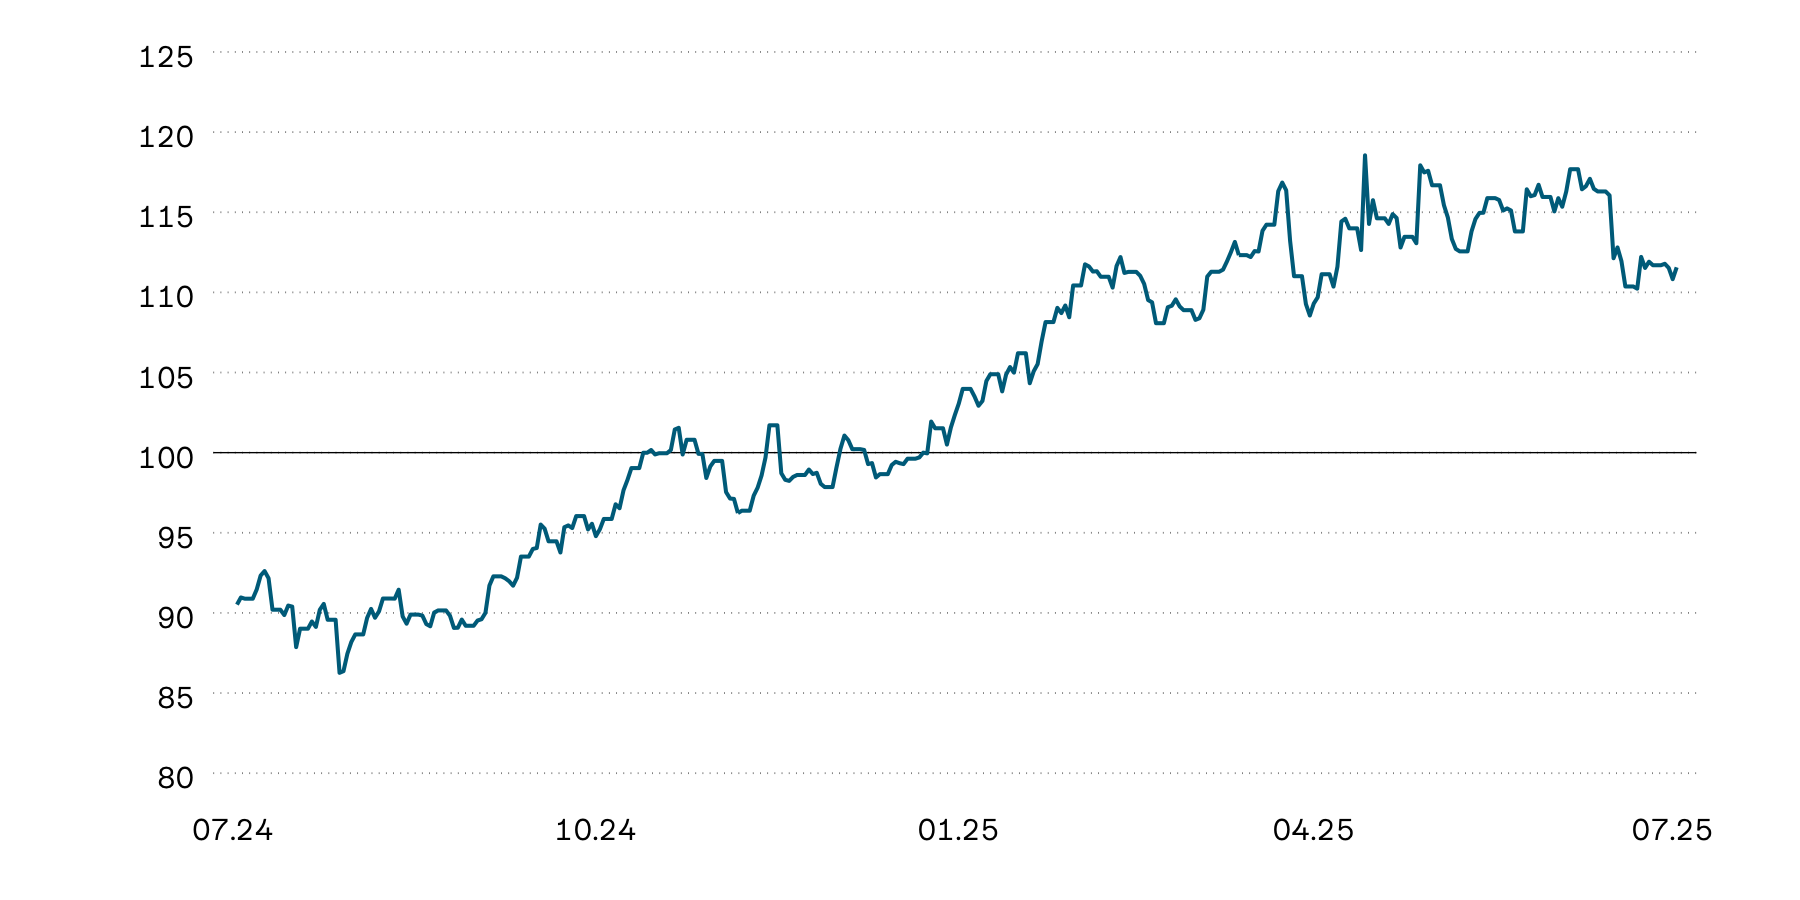
The prices of exchange-listed Swiss real estate funds rose sharply last month, edging back into positive territory on an annual basis.
Indexed performance of Swiss real estate funds
100 = 01.01.2026
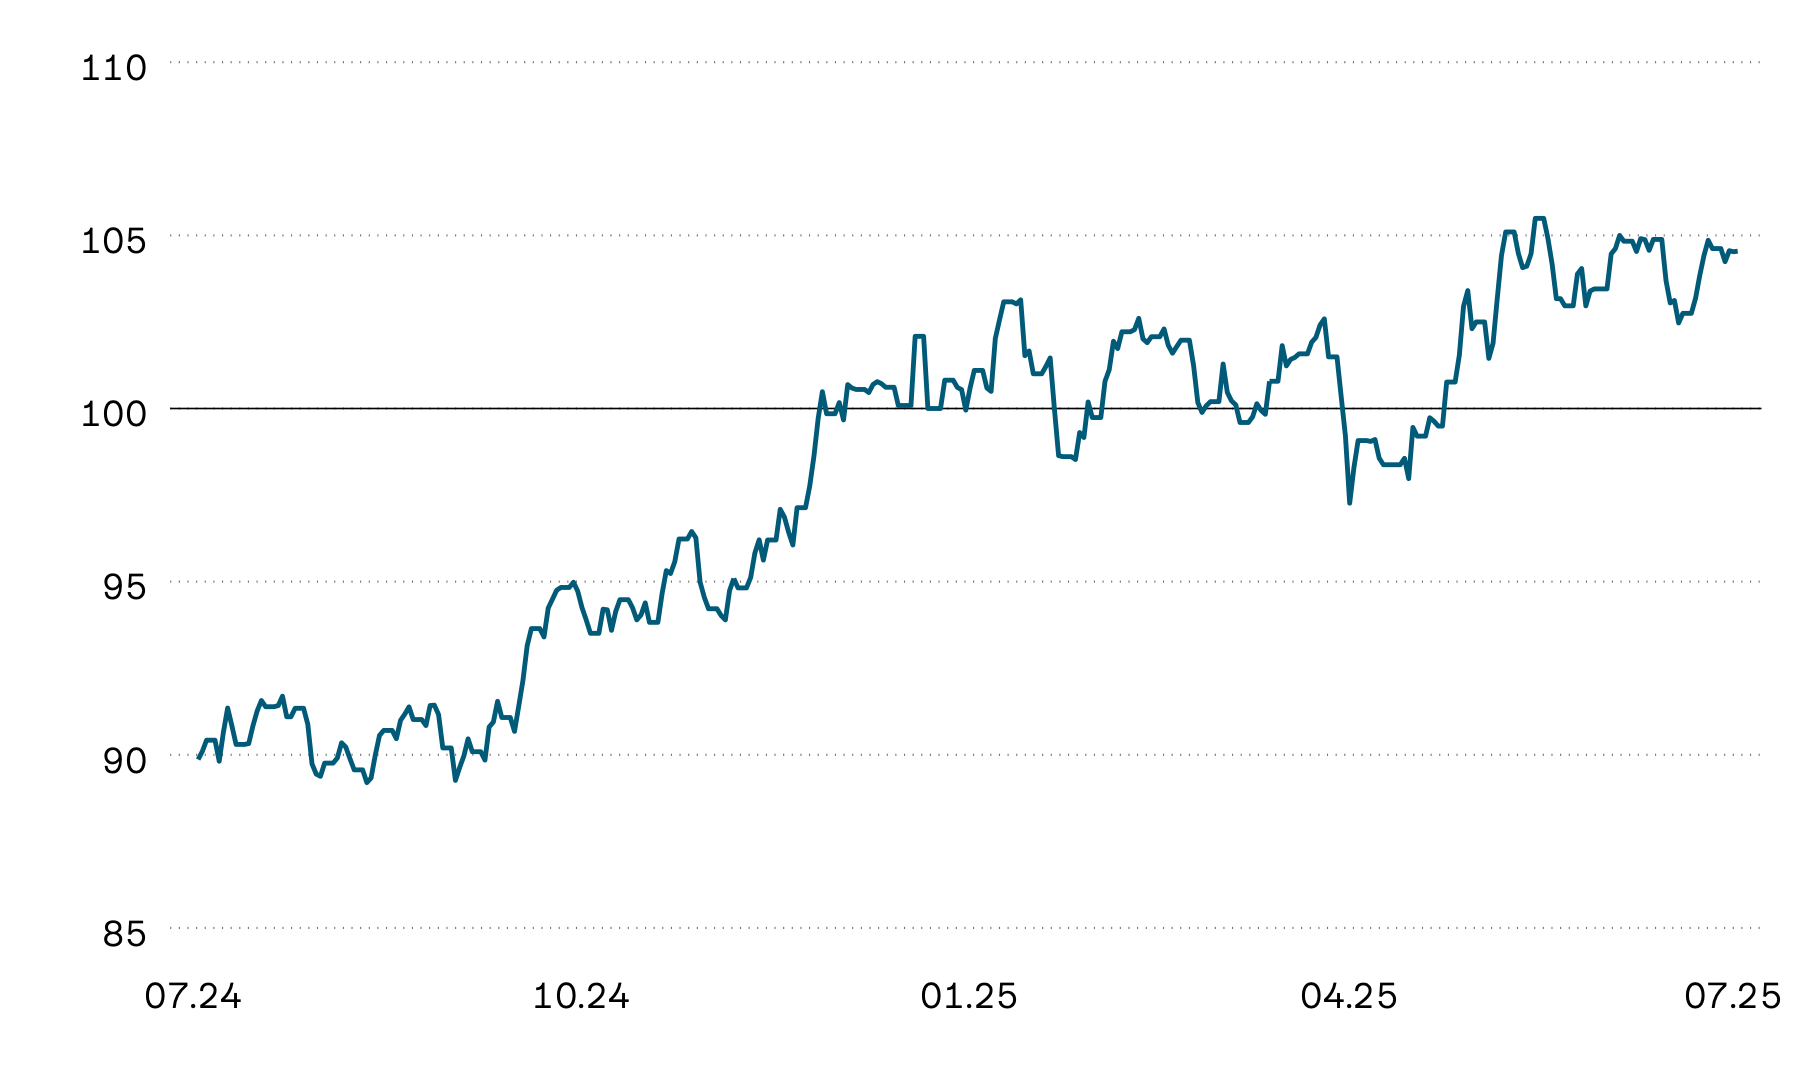
After a significant correction in the first week of June, exchange-listed Swiss real estate funds made a strong recovery last month, rising by over 6 percent. This was mainly due to the temporary fall in long-term Swiss capital market interest rates. Despite the recent rise in interest rates, real estate funds have so far managed to escape this trend. Thanks to the recovery, their annual return is now up again slightly. While it remains below that of the Swiss equity market, it has improved significantly compared to the previous month.
Premium on Swiss real estate funds and 10-year yields to maturity
In percent
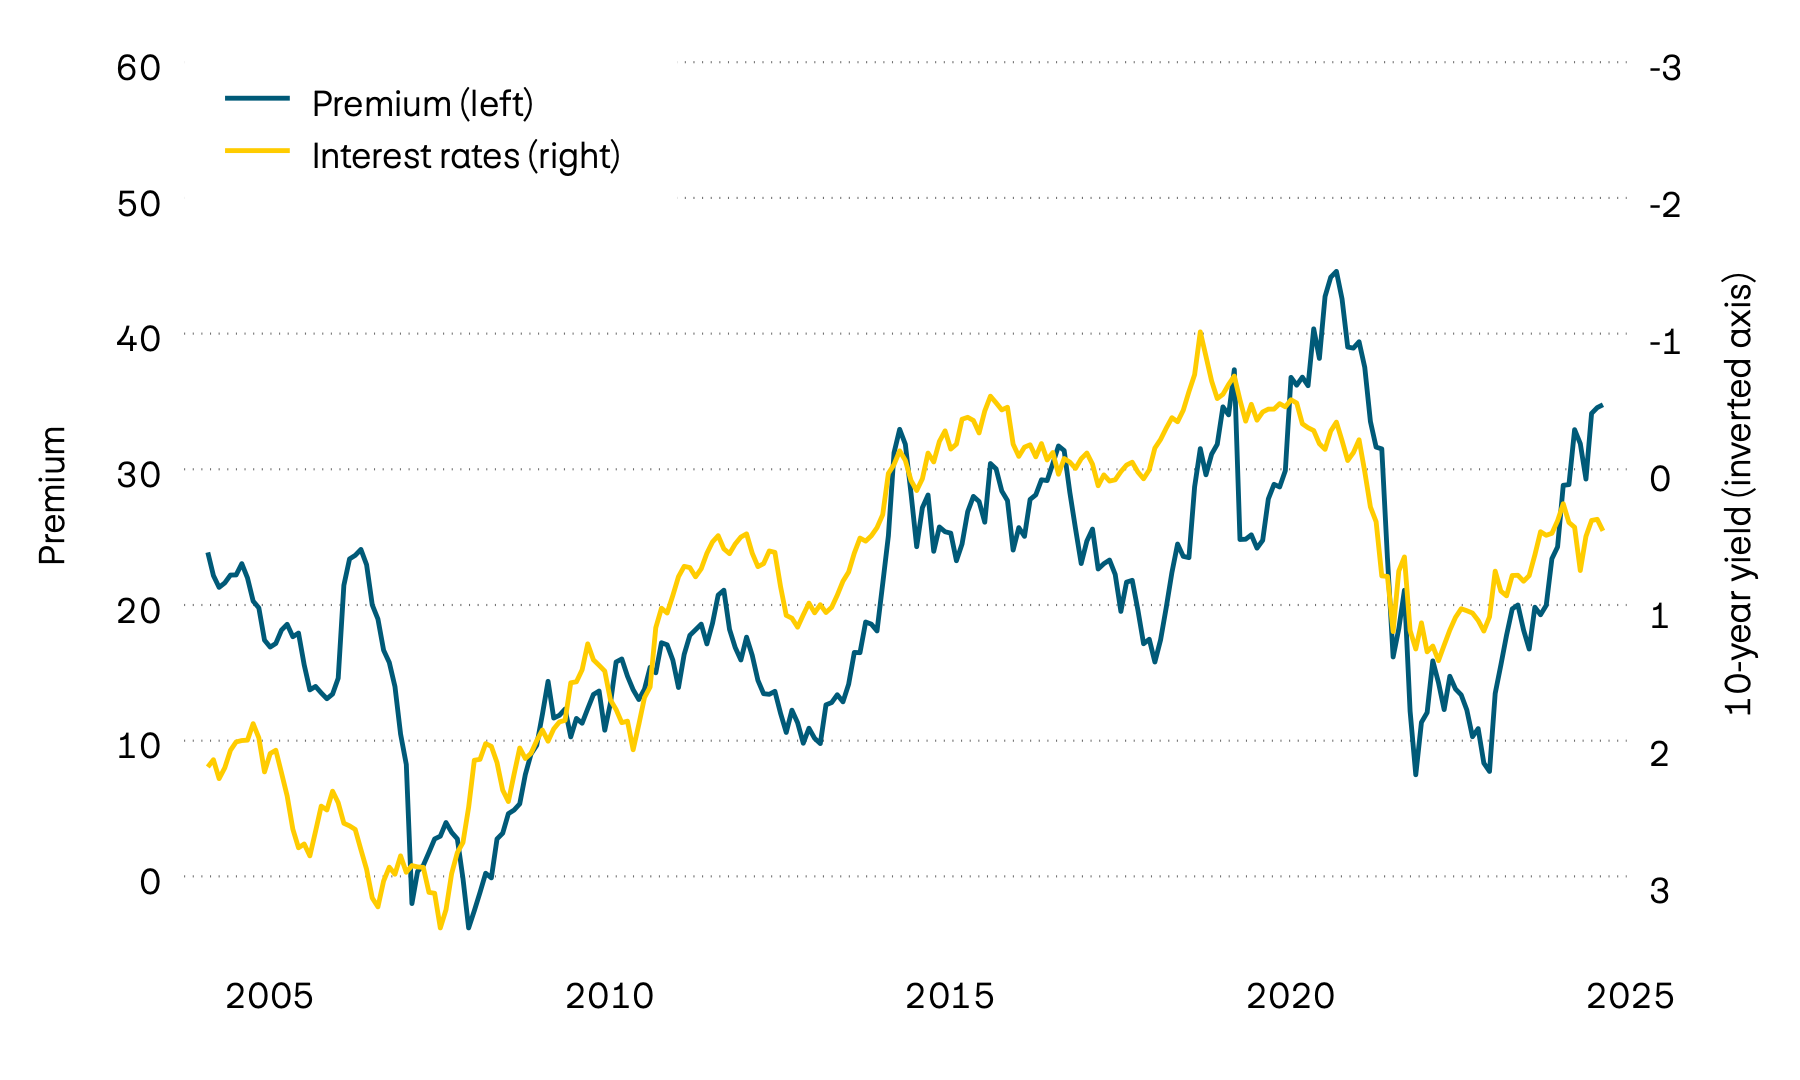
The recovery in Swiss real estate fund prices has also driven their valuations back up. As such, the premium that investors pay for exchange-listed Swiss real estate funds compared to the net asset value is close to historic highs again.
Vacancy rate and real estate prices
100 = January 2000 (left) and in percent (right)
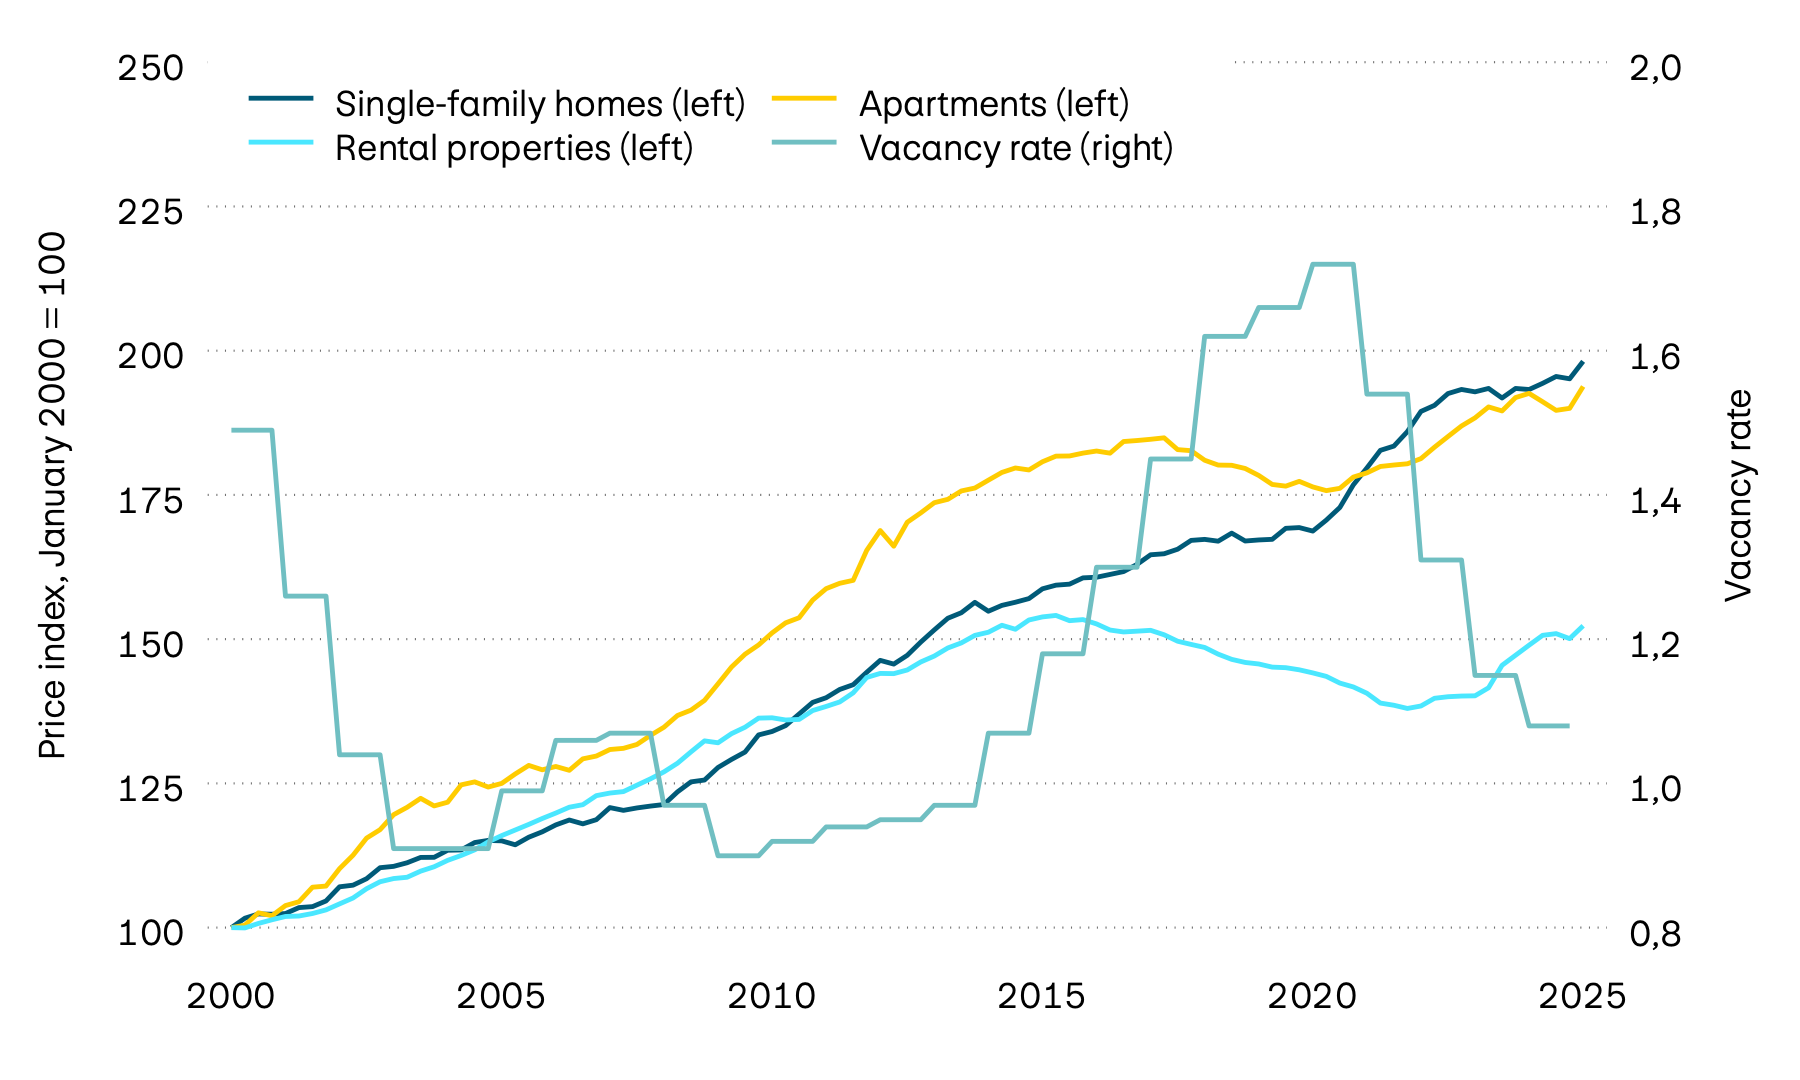
Swiss real estate prices were more mixed in the second quarter than of late. After four quarters of price increases, single-family house prices fell slightly, while apartment prices continued their upward trend. Rental property prices also rose further, though still only to a minor extent. However, the year-on-year trend in both categories remains clearly positive: apartment prices rose by around 3 percent and single-family home prices by around 2 percent. The vacancy rate is still at a very low level, which is likely to remain the main reason for high real estate prices overall.
Find out more in our interest rate forecast for mortgages.
Currencies
The US dollar remains strong, having risen by around 1 percent against the Swiss franc again last month. In contrast, the Swiss franc remained broadly stable against the euro, continuing the sideways trend observed since the start of the year.
| Currency pair | Price | PPP | Neutral range | Valuation |
|---|---|---|---|---|
| Currency pair EUR/CHF |
Price 0.92 |
PPP 0.87 |
Neutral range 0.80 – 0.93 |
Valuation Euro neutral |
| Currency pair USD/CHF |
Price 0.80 |
PPP 0.74 |
Neutral range 0.64 – 0.83 |
Valuation USD neutral |
| Currency pair GBP/CHF |
Price 1.07 |
PPP 1.08 |
Neutral range 0.94 – 1.22 |
Valuation Pound sterling neutral |
| Currency pair JPY/CHF |
Price 0.50 |
PPP 0.78 |
Neutral range 0.63 – 0.94 |
Valuation Yen undervalued |
| Currency pair SEK/CHF |
Price 8.32 |
PPP 9.29 |
Neutral range 8.30 – 10.27 |
Valuation Krona neutral |
| Currency pair NOK/CHF |
Price 8.16 |
PPP 9.35 |
Neutral range 8.25 – 10.45 |
Valuation Krone undervalued |
| Currency pair EUR/USD |
Price 1.14 |
PPP 1.18 |
Neutral range 1.02 – 1.34 |
Valuation Euro neutral |
| Currency pair USD/JPY |
Price 161.38 |
PPP 93.80 |
Neutral range 70.35 – 117.26 |
Valuation Yen undervalued |
| Currency pair USD/CNY |
Price 6.78 |
PPP 6.42 |
Neutral range 5.90 – 6.95 |
Valuation Renminbi neutral |
Source: Allfunds Tech Solutions
The US dollar continued to hold its ground as the strongest of the major currencies last month. On an annual basis, however, the appreciation against the Swiss franc remains moderate at just under 2 percent. The euro/Swiss franc currency pair has also remained virtually unchanged since April. Overall, few distinct trends can be seen on the foreign exchange markets. Most major currency pairs have been trading in tight ranges for some time and show only minor changes on an annual basis.
Cryptocurrencies
| Cryptocurrency | Price | YTD in USD | Annual high | Annual low |
|---|---|---|---|---|
| Cryptocurrency BITCOIN |
Price 63,186 |
YTD in USD -27.78% |
Annual high 96,942 |
Annual low 58,526 |
| Cryptocurrency ETHEREUM |
Price 1,745 |
YTD in USD -41.20% |
Annual high 3,354 |
Annual low 1,569 |
Source: Allfunds Tech Solutions, Coin Metrics Inc
Gold
Last month, the precious metal failed to match its strong performance at the start of the year. The gold price fell by around 2 percent in Swiss franc terms.
Indexed performance of gold in Swiss francs
100 = 01.01.2026
After performing exceptionally strongly at the start of the year, the value of gold has fallen significantly in recent months. Calculated in Swiss francs, the precious metal is now down by around 3 percent on an annual basis. Long-term capital market interest rates, which are higher by historical standards, continue to have a negative impact. Higher interest rates increase the opportunity costs of gold, as the precious metal does not generate any current income. However, the price decline has slowed recently, and gold has been trading largely stably again for some time at just over 4,000 US dollars per troy ounce.